Mathematics - Data Handling
Data Handling – Pre-Assessment
Date: 30 August 2016
Learning Outcomes:
Assessment tool: Teacher's notes
Date: 30 August 2016
Learning Outcomes:
- Collect, organise, and represent data (including bar and line graphs, 3 ring Venn diagrams, pie charts, Carroll diagrams and tree diagrams) where one object or symbol can represent many data values.
Assessment tool: Teacher's notes

|

|
Notes: Seem to have a good understanding of the Venn Diagram. They came up with three animals and were able to find similarities and differences with little support.
Carroll diagram was done with ease.
Next steps are to figure out how to label the diagrams properly and come up with more complex topics.
Carroll diagram was done with ease.
Next steps are to figure out how to label the diagrams properly and come up with more complex topics.
Reflection:I like doing the venn diagram and the carroll because it is fun to do and easy to know when people look at it.
Data Handling – Bar Graphs
Date: 30 August 2016
Learning Outcomes:
Collect, organise, and represent data (including bar and line graphs, 3 ring Venn diagrams, pie charts, Carroll diagrams and tree diagrams) where one object or symbol can represent many data values. Describe the advantages and disadvantages of data representation from answering and suggesting questions that can be answered.
Task: Students had to ask questions to collect data then organise it in a bar graph that included all the essential elements. They can reflect on the advantages and disadvantages of data representation using a Bar Graph.
Assessment tool: Checklist

|

|

Reflection:I like collecting people in my class and ask them what is your favourite animal and they tell me what they like and also making the bar graph is fun too.
Data Handling – Line Graphs
Date: 1 September 2016
Learning Outcomes:
Assessment tool: Checklist
Date: 1 September 2016
Learning Outcomes:
- Collect, organise, and represent data (including bar and line graphs, 3 ring Venn diagrams, pie charts, Carroll diagrams and tree diagrams) where one object or symbol can represent many data values.
- Describe the advantages and disadvantages of data representation from answering and suggesting questions that can be answered.
Assessment tool: Checklist

|

|
Reflection: I think this was fun t do.
Data Handling – Pie Graphs
Date: 5 September 2016
Learning Outcomes:
Collect, organise, and represent data (including bar and line graphs, 3 ring Venn diagrams, pie charts, Carroll diagrams and tree diagrams) where one object or symbol can represent many data values. Describe the advantages and disadvantages of data representation from answering and suggesting questions that can be answered.
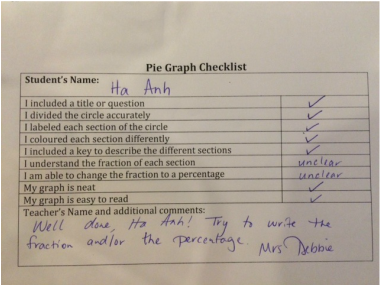
Task: Students had to organise the data provided on a pie graph that included all the essential elements. They also had to figure out the fraction and percentage of each section. They can reflect on the advantages and disadvantages of data representation using a Pie Graph.
Assessment tool: Checklist
Date: 5 September 2016
Learning Outcomes:
Collect, organise, and represent data (including bar and line graphs, 3 ring Venn diagrams, pie charts, Carroll diagrams and tree diagrams) where one object or symbol can represent many data values. Describe the advantages and disadvantages of data representation from answering and suggesting questions that can be answered.
Task: Students had to organise the data provided on a pie graph that included all the essential elements. They also had to figure out the fraction and percentage of each section. They can reflect on the advantages and disadvantages of data representation using a Pie Graph.
Assessment tool: Checklist

|
|
Reflection:
Data Handling – Venn Diagram
Date: 12 September 2016
Learning Outcomes:
Collect, organise, and represent data (including bar and line graphs, 3 ring Venn diagrams, pie charts, Carroll diagrams and tree diagrams) where one object or symbol can represent many data values. Describe the advantages and disadvantages of data representation from answering and suggesting questions that can be answered.
Task: Students worked in groups to compare and contrast three devices on a Venn Diagram that included the essential elements. They can reflect on the advantages and disadvantages of data representation using a Venn Diagram.
Assessment tool: Checklist

|

|
Reflection:
Data Handling – Tree Diagram
Date: 13 September 2016
Learning Outcomes:
Assessment tool: Checklist
Date: 13 September 2016
Learning Outcomes:
- Collect, organise, and represent data (including bar and line graphs, 3 ring Venn diagrams, pie charts, Carroll diagrams and tree diagrams) where one object or symbol can represent many data values.
- Describe the advantages and disadvantages of data representation from answering and suggesting questions that can be answered.
Assessment tool: Checklist

|

|
Reflection:
Data Handling – Carroll Diagram
Date: 14 September 2016
Learning Outcomes:
Assessment tool: Checklist
Date: 14 September 2016
Learning Outcomes:
- Collect, organise, and represent data (including bar and line graphs, 3 ring Venn diagrams, pie charts, Carroll diagrams and tree diagrams) where one object or symbol can represent many data values.
- Describe the advantages and disadvantages of data representation from answering and suggesting questions that can be answered.
Assessment tool: Checklist

|

|
Reflection:
Data Handling – Summative Assessment
Date: 22 September 2016
Learning Outcomes:
· Collect, organise, and represent data (including bar and line graphs, 3 ring Venn diagrams, pie charts, Carroll diagrams and tree diagrams) where one object or symbol can represent many data values.
· Interpret and draw conclusions from data.
· Describe the advantages and disadvantages of data representation from answering and suggesting questions that can be answered.
Task: Students worked in groups to come up with a question related to our lines of inquiry:
· Virtual Communities
· Evaluating information
· Our responsibility in a virtual environment
They had to work together to collect data from students and/or teachers at ISV. From there, they had to organise and represent their data in a graph or diagram. They also had to draw conclusions from the data using scale, range, mode, median and mean. While presenting their graph or diagram to the class, they had to describe the advantages and disadvantages of data representation with their graph/diagram.
Assessment tool: Scale, checklist and teacher’s notes


